People normally don’t want to go through a large amount of data presented to them in form of text or tables. Mostly that’s because it is boring, but more importantly, it’s a little harder to process raw numbers.
Here is a table of the ten most populous countries in the world:
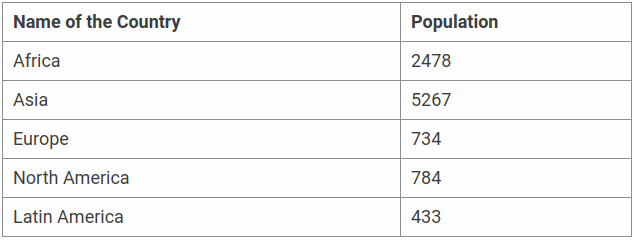
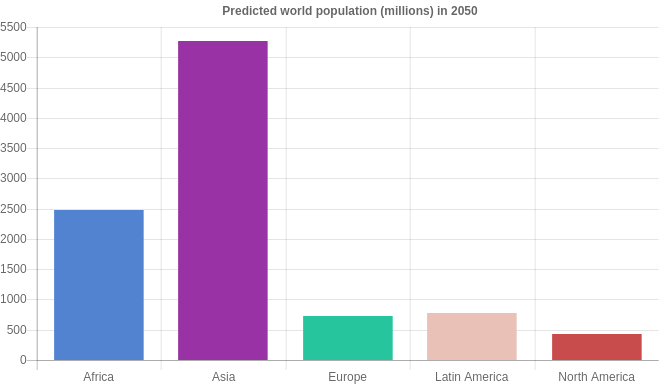
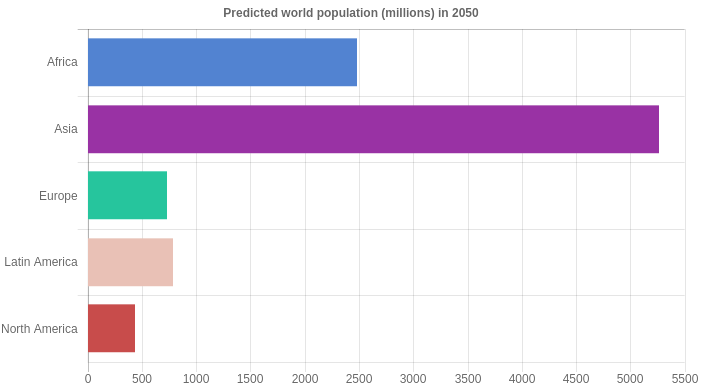
With only five countries in this table, there is still a very good chance that you and other will skip over the table entirely. Normally, people only look at one or two countries that interest them. If the same data had been presented in the form of a bar chart, it would have taken very little time for someone to get a rough idea of the population in these countries.
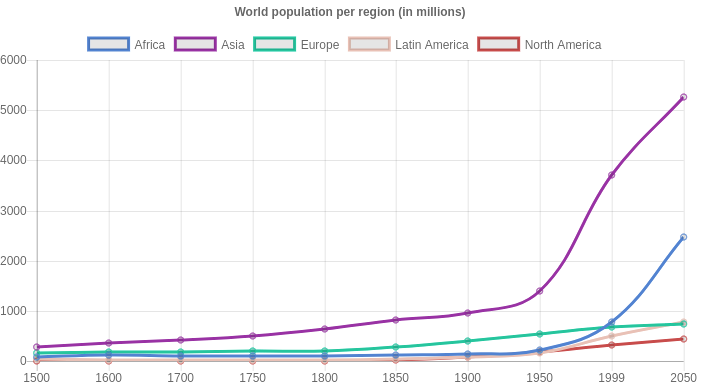
Moreover, it will be a lot easier to figure out trends or facts, for example, Asia is twice as populated as Africa, and Asia has about ten times more people than Latin America by looking at the length of bars in the chart.
react-chartjsx
The official React chart.js components. A simple yet flexible react chart components for designers & developers that you can use to create different kinds of charts is react-chartjsx. In this series, you will be learning about all the important aspects of this react chart components. It can be used to create fancy, responsive charts on HTML5 Canvas.
react-chartjsx allows you to mix different chart types and plot data on date time, logarithmic, or custom scales with ease. The library also sports out-of-the-box animations that can be applied when changing data or updating colors.
Let’s get started with the installation, and then we’ll move on to configuration options and other aspects.
Installation
1
| |
Usage
1 2 3 4 5 6 7 8 9 10 11 | |
Properties
- data: PropTypes.object.isRequired
- width: PropTypes.number
- height: PropTypes.number
- options: PropTypes.object
- redraw: PropTypes.bool
- getDatasetAtEvent: PropTypes.func
- getElementAtEvent: PropTypes.func
- getElementsAtEvent: PropTypes.func
- getChart: PropTypes.func
- getCanvas: PropTypes.func
Redraw
If you want the chart destroyed and redrawn on every change, pass in redraw as true.
1 2 3 4 5 6 7 | |
Custom size
To custom size you need to set responsive to false.
1 2 3 4 5 6 7 8 | |
Events
getDatasetAtEvent
Looks for the element under the event point, then returns all elements from that dataset. This is used internally for ‘dataset’ mode highlighting.
1 2 3 4 5 6 7 8 9 | |
getElementAtEvent
Calling getElementAtEvent(event) on your Chart instance passing an argument of an event, will return the single element at the event position. If there are multiple items within range, only the first is returned.
1 2 3 4 5 6 7 8 9 | |
getElementsAtEvent
A function to be called when mouse clicked on chart elememts, will return all element at that point as an array.
1 2 3 4 5 6 7 8 9 | |
getChart
A function to be called for getting chartjs object.
1 2 3 4 5 6 7 8 9 | |
getCanvas
A function to be called for getting canvas element.
1 2 3 4 5 6 7 8 9 | |
Sample
Bar chart
1 2 3 4 5 6 7 8 9 10 11 12 13 14 15 16 17 18 19 20 21 22 23 24 25 26 27 28 29 30 31 32 33 34 35 | |
Line chart
1 2 3 4 5 6 7 8 9 10 11 12 13 14 15 16 17 18 19 20 21 22 23 24 25 26 27 28 29 30 31 32 33 34 35 36 37 38 39 40 41 42 43 44 45 46 47 48 49 50 51 52 53 54 55 56 | |
Pie chart
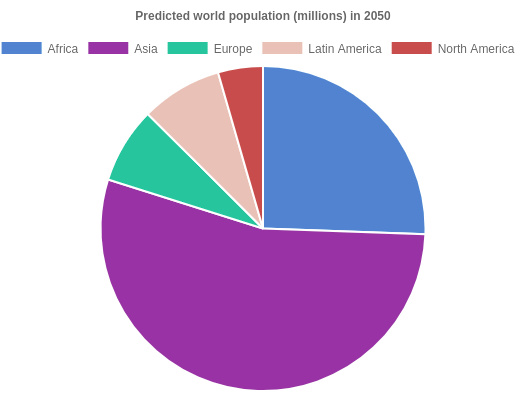
1 2 3 4 5 6 7 8 9 10 11 12 13 14 15 16 17 18 19 20 21 22 23 24 25 26 27 28 29 30 31 32 33 | |
Radar chart
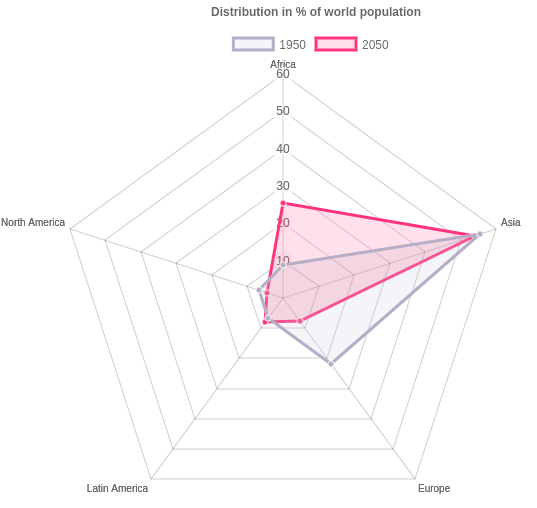
1 2 3 4 5 6 7 8 9 10 11 12 13 14 15 16 17 18 19 20 21 22 23 24 25 26 27 28 29 30 31 32 33 34 35 36 37 38 39 40 41 42 43 44 45 46 47 48 | |
Polar area chart
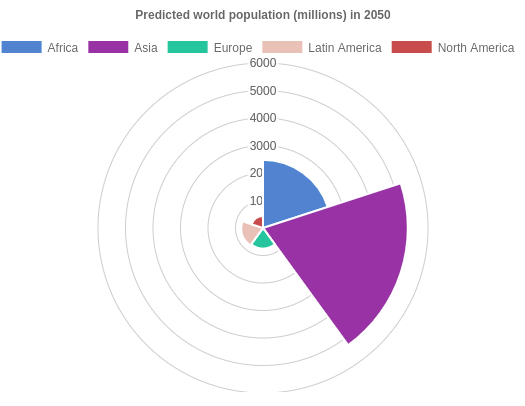
1 2 3 4 5 6 7 8 9 10 11 12 13 14 15 16 17 18 19 20 21 22 23 24 25 26 27 28 29 30 31 32 33 34 35 | |
Doughnut chart
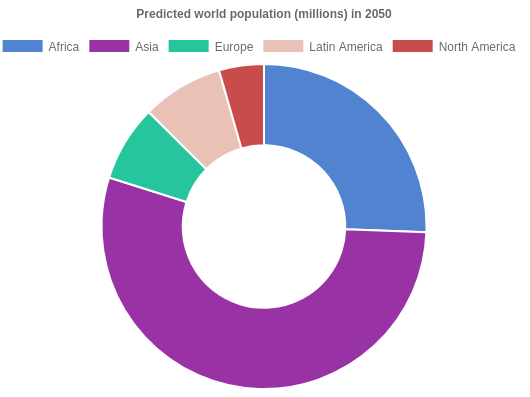
1 2 3 4 5 6 7 8 9 10 11 12 13 14 15 16 17 18 19 20 21 22 23 24 25 26 27 28 29 30 31 32 33 34 35 | |
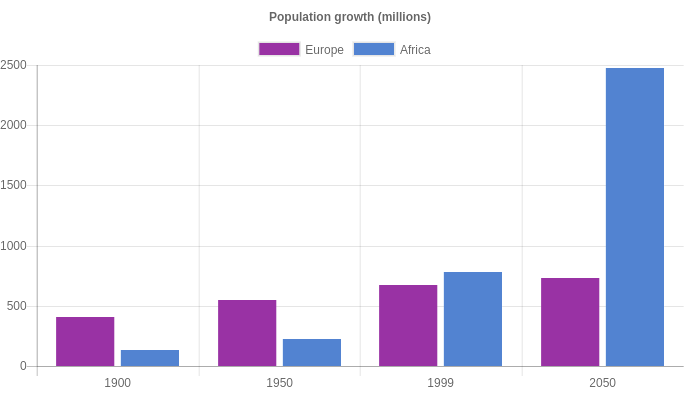
Horizontal bars chart
1 2 3 4 5 6 7 8 9 10 11 12 13 14 15 16 17 18 19 20 21 22 23 24 25 26 27 28 29 30 31 32 33 34 35 | |
Grouped bars chart
1 2 3 4 5 6 7 8 9 10 11 12 13 14 15 16 17 18 19 20 21 22 23 24 25 26 27 28 29 30 31 32 33 34 35 36 37 38 39 | |
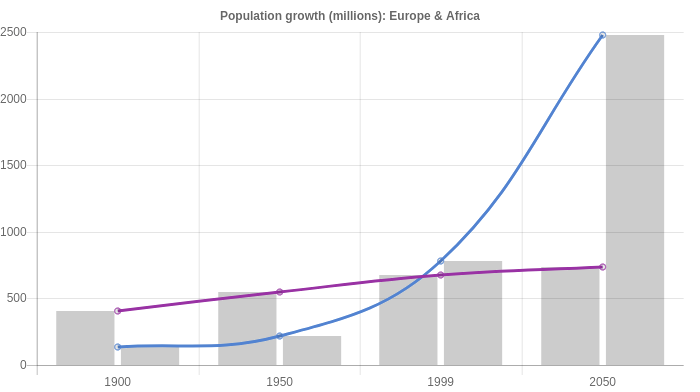
Mixed charts
1 2 3 4 5 6 7 8 9 10 11 12 13 14 15 16 17 18 19 20 21 22 23 24 25 26 27 28 29 30 31 32 33 34 35 36 37 38 39 40 41 42 43 44 45 46 47 48 49 50 51 52 53 | |
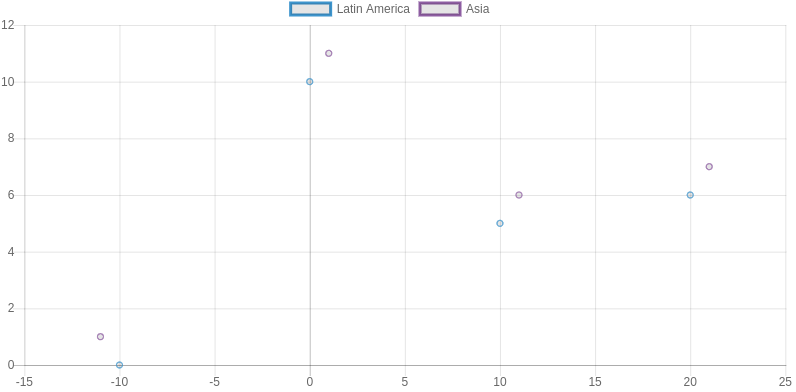
Bubble chart
1 2 3 4 5 6 7 8 9 10 11 12 13 14 15 16 17 18 19 20 21 22 23 24 25 26 27 28 29 30 31 32 33 34 35 36 37 38 39 40 41 42 43 44 45 46 47 48 49 50 51 52 53 54 55 56 57 58 59 60 61 62 63 64 65 66 | |
Well, You can read all details on the project’s GitHub repo.