People normally don’t want to go through a large amount of data presented to them in form of text or tables. Mostly that’s because it is boring, but more importantly, it’s a little harder to process raw numbers.
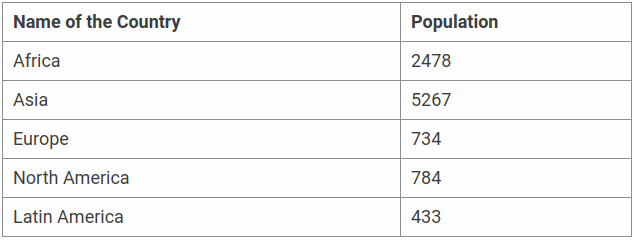
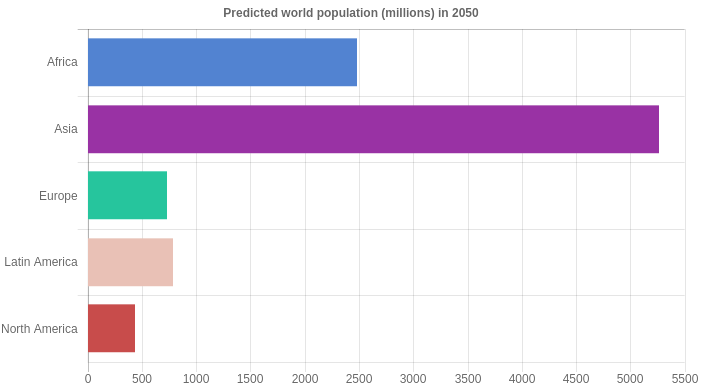
Here is a table of the ten most populous countries in the world:
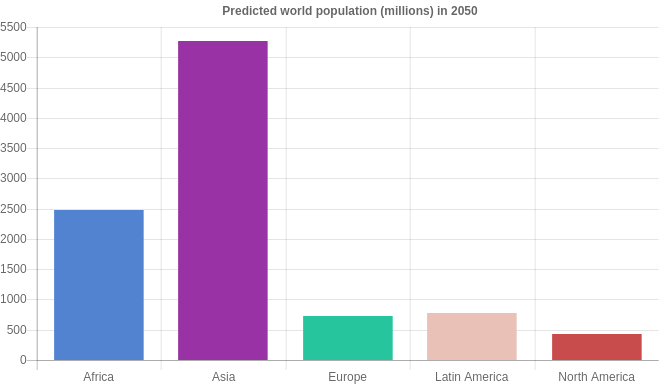
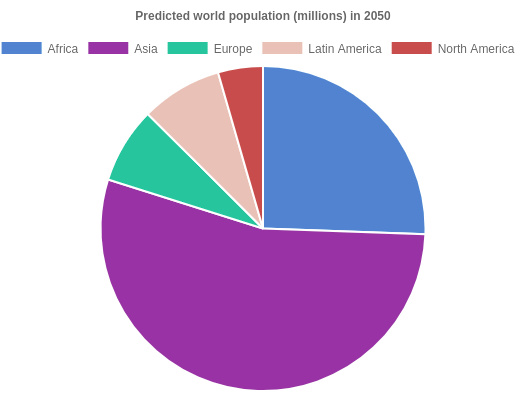
With only five countries in this table, there is still a very good chance that you and other will skip over the table entirely. Normally, people only look at one or two countries that interest them. If the same data had been presented in the form of a bar chart, it would have taken very little time for someone to get a rough idea of the population in these countries.
Moreover, it will be a lot easier to figure out trends or facts, for example, Asia is twice as populated as Africa, and Asia has about ten times more people than Latin America by looking at the length of bars in the chart.
react-chartjsx
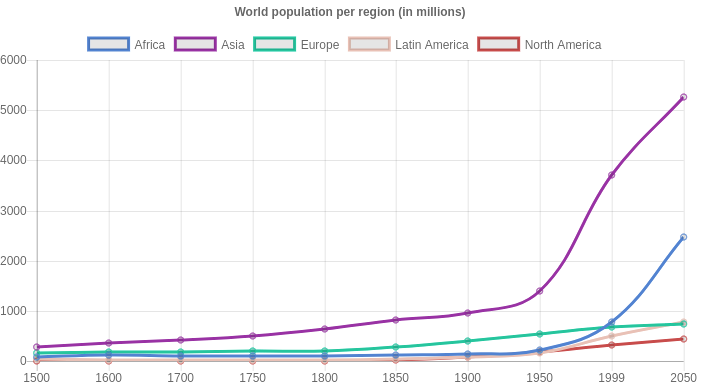
The official React chart.js components. A simple yet flexible react chart components for designers & developers that you can use to create different kinds of charts is react-chartjsx. In this series, you will be learning about all the important aspects of this react chart components. It can be used to create fancy, responsive charts on HTML5 Canvas.
react-chartjsx allows you to mix different chart types and plot data on date time, logarithmic, or custom scales with ease. The library also sports out-of-the-box animations that can be applied when changing data or updating colors.
Let’s get started with the installation, and then we’ll move on to configuration options and other aspects.
getDatasetAtEvent
Looks for the element under the event point, then returns all elements from that dataset. This is used internally for ‘dataset’ mode highlighting.
getElementAtEvent
Calling getElementAtEvent(event) on your Chart instance passing an argument of an event, will return the single element at the event position. If there are multiple items within range, only the first is returned.
With images making up a whopping 65% of all web content, page load time on websites can easily become an issue.
Images can weight quite a bit. This can have a negative impact on the time visitors have to wait before they can access content on your website. they will get navigate somewhere else, unless you come up with a solution to image loading.
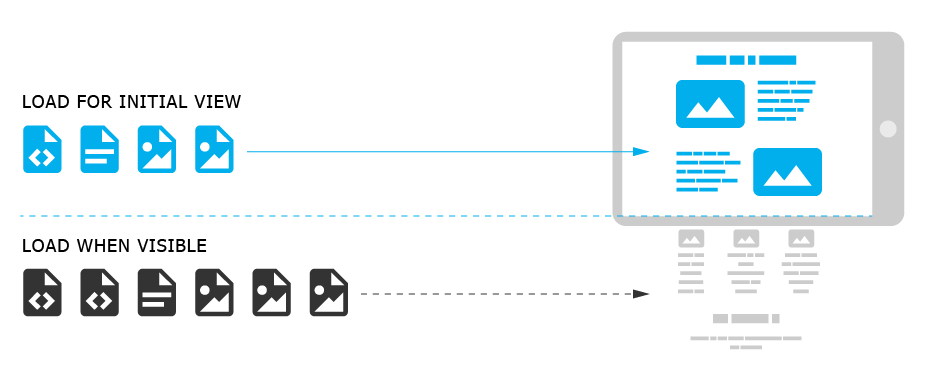
What is lazy loading?
Lazy loading images means loading images on websites asynchronously that is, after the content is fully loaded, or even conditionally, only when they appear in the browser’s viewport. This means that if users don’t scroll all the way down, images placed at the bottom of the page won’t be loaded.
What reason you should care of lazy loading images?
There are many reasons you should consider of lazy loading images for your website:
If your website uses JavaScript to display content or provide some functionality to users, loading the DOM quickly becomes critical. It’s common for scripts to wait until the DOM has completely loaded before they start running. On a site with a number of images, lazy loading or loading images asynchronously could make the difference between users staying or leaving your website.
Since most lazy loading solutions work by loading images only if the user has scrolled to the location where images would be visible inside the viewport, those images will never be loaded if users never get to that point. This means considerable savings in bandwidth, for which most users, especially those accessing the web on mobile devices and slow-connections.
Lazy loading images helps with website performance, but what’s the best way to go about it?
Well, lazy-load-images.js is a javascript library which could help you with the website performance.
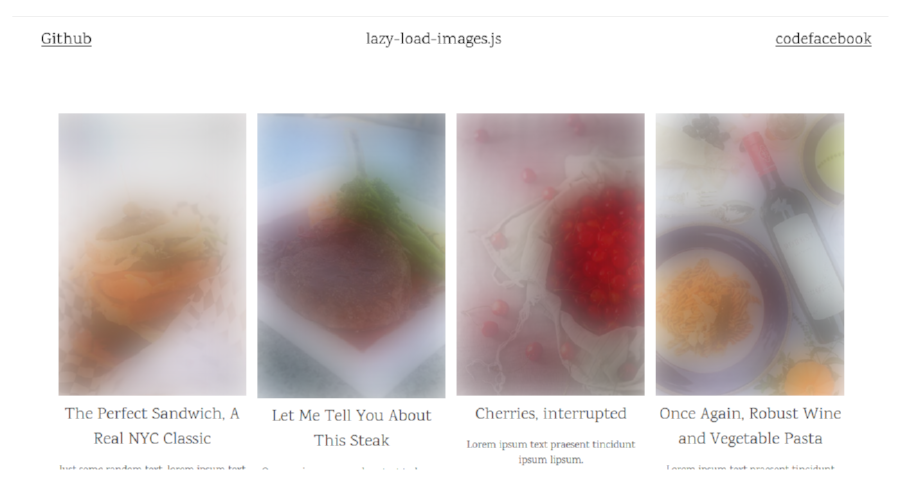
lazy-load-images.js is loading with blurred image effect
If you are a Medium reader, you have certainly noticed how the site loads the main image inside a post.
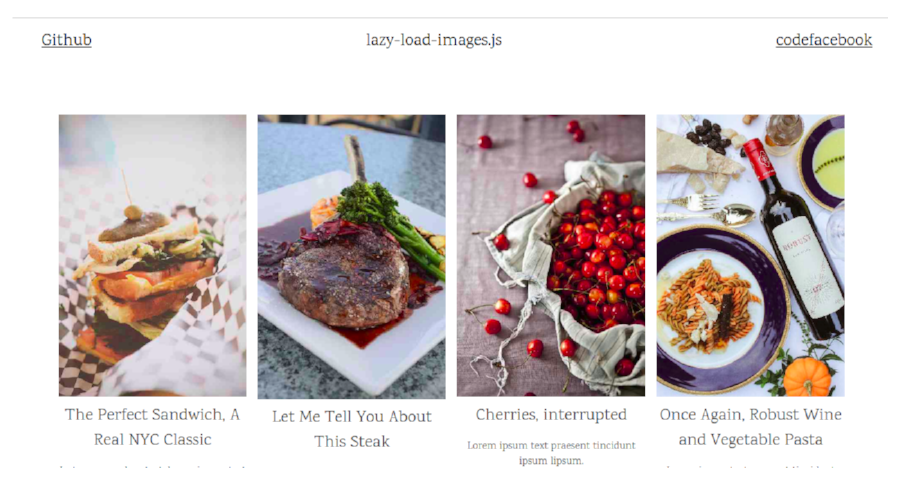
The first thing you see is a blurred, low-resolution copy of the image, while its high-resversion is being lazy loaded:
You can lazy load images with this interesting blurring effect in a number of ways.
My favorite technique/library is using lazy-load-images.js. Here’s all the features/goodness:
- Fast loading
- High performance
- Supports all images type
- Responsive images
- Supports all modern browsers Chrome, Firefox, Safari, (IE10+), … etc.
You can read all details and download the lazy-load-images.js library on the project’s GitHub repo.
Well, to serve static files such as sitemap.xml, robots.txt and favicon.ico with Next.js you just put those static files in static folder and add the below code to your server (server.js) config:
The way to import css files into Nextjs is very simple:
1. Create a /static folder at the same level of /pages folder.
2. In /static folder put your .css files.
3. In your pages components import Head and add a CSS .
12345678910111213
importHeadfrom'next/head'exportdefault()=>(<div><Head><title>Mystylespages</title> <link href="/statics/styles.css" rel="stylesheet" /> </Head> <p className="some-class-name"> Welcome to my styles pages! </p> </div>)
This way Nextjs render the link tag in the head of the page and the browser will download the CSS and applied it.
As @arunoda (Next.js founder) said Next.js does not support importing markdown files yet. But you can configure the Next.js webpack loaders to load raw-loader modules and import markdown files and return them as strings.
Let get started!
Open the terminal, run the command below to install raw-loader and react-markdown modules (noted: use react-markdown to renders markdown as pure React components):
I was researching for the rich UI frameworks based on ReactJs which give the power of composability through ReactJs components, that you can directly plug in into your ReactJs project. Let go through the list below and pickup the right one.
Material-UI
Material-UI is a set of ReactJs components which implement Google’s Material Design. Source
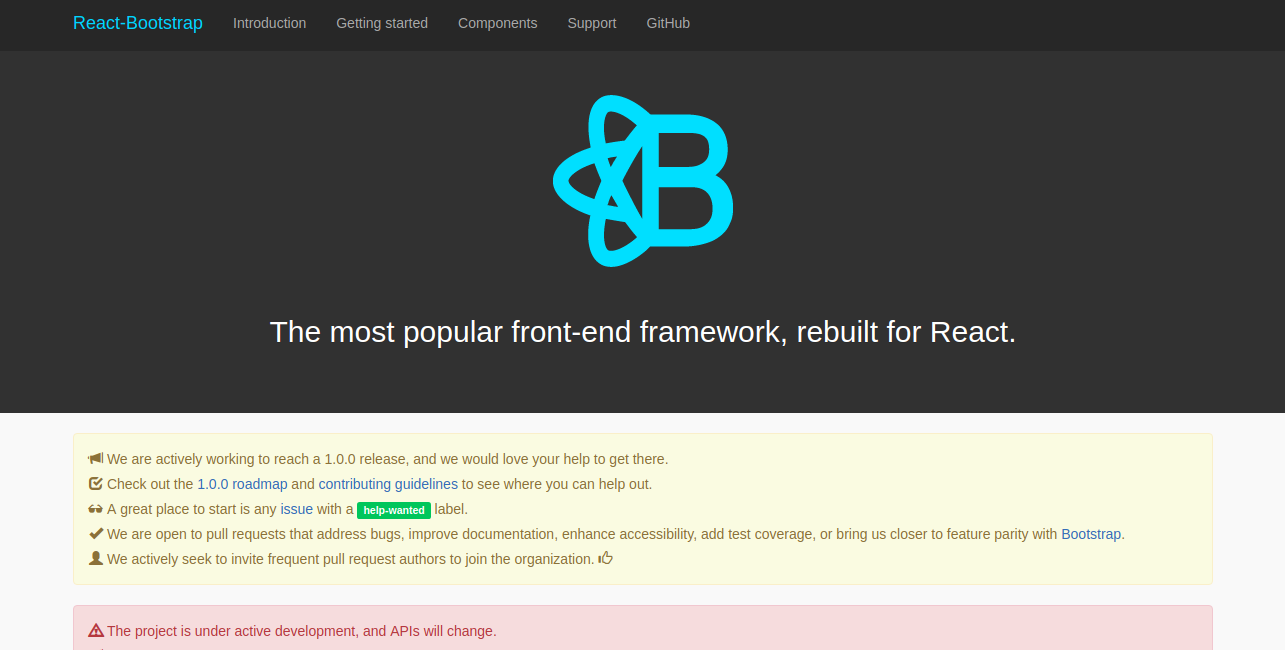
React-Bootstrap
Bootstrap is one of the most advanced UI frameworks out there and has got most of the things right. Source
React-Foundation
Foundation from Zurb is a very feature-rich and easily customizable library. Source
React-Semantic
Semantic UI React is the official React integration for Semantic UI. Source
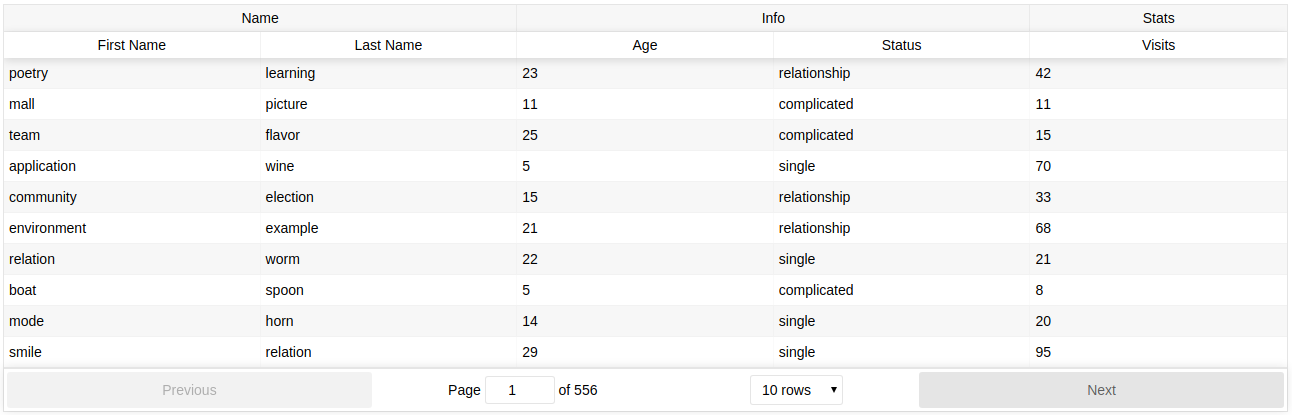
I’ve been researching this for many days so I can help you at least find the ones out there. I don’t have experience with most of these but the one I do have experience with is one I don’t recommend as it seems unmaintained. Though I did find it well documented and easy to use. My requirements aren’t particularly complicated for a data-grid component, I basically look at filtering, sorting and row selection. If you need anything more complicated you’ll have to dig further into the documentations.
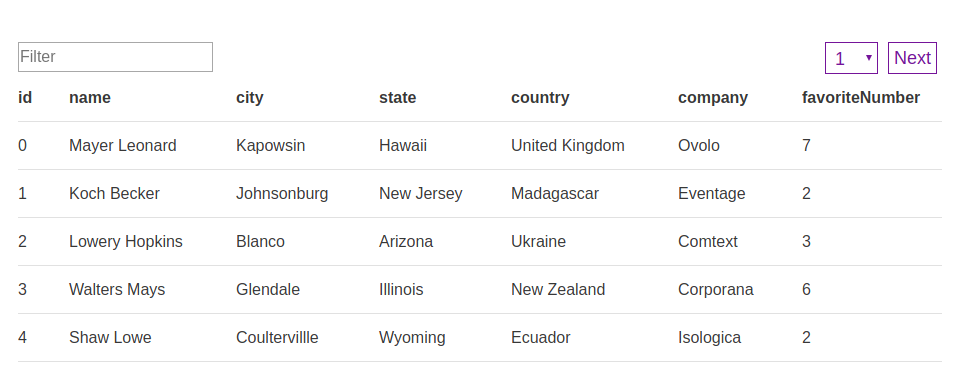
React-Data-Grid
Excel-liked grid component built with React, with editors, keyboard navigation, copy & paste, and the like http://adazzle.github.io/react-data-grid.
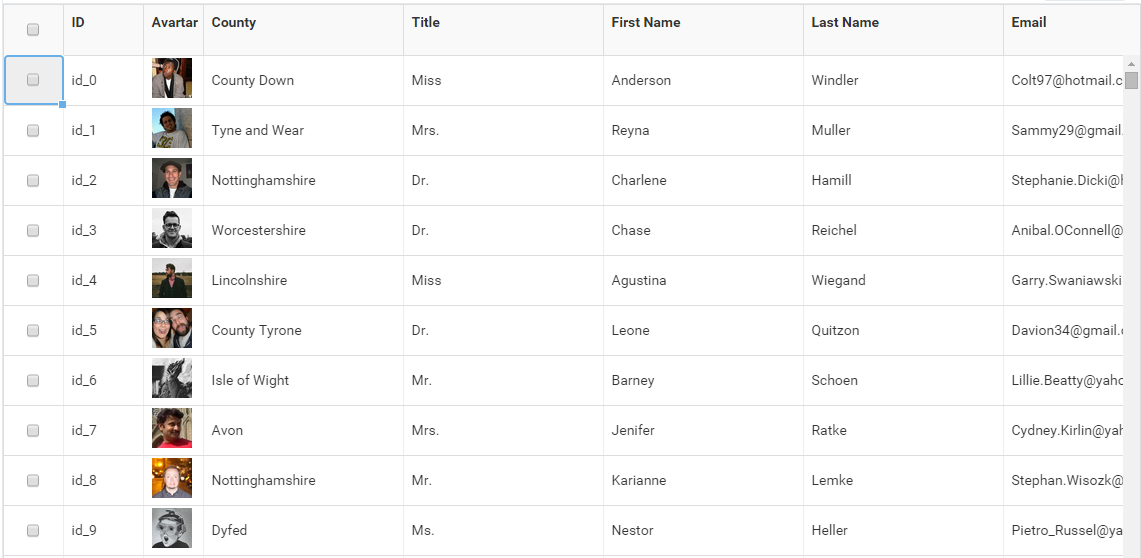
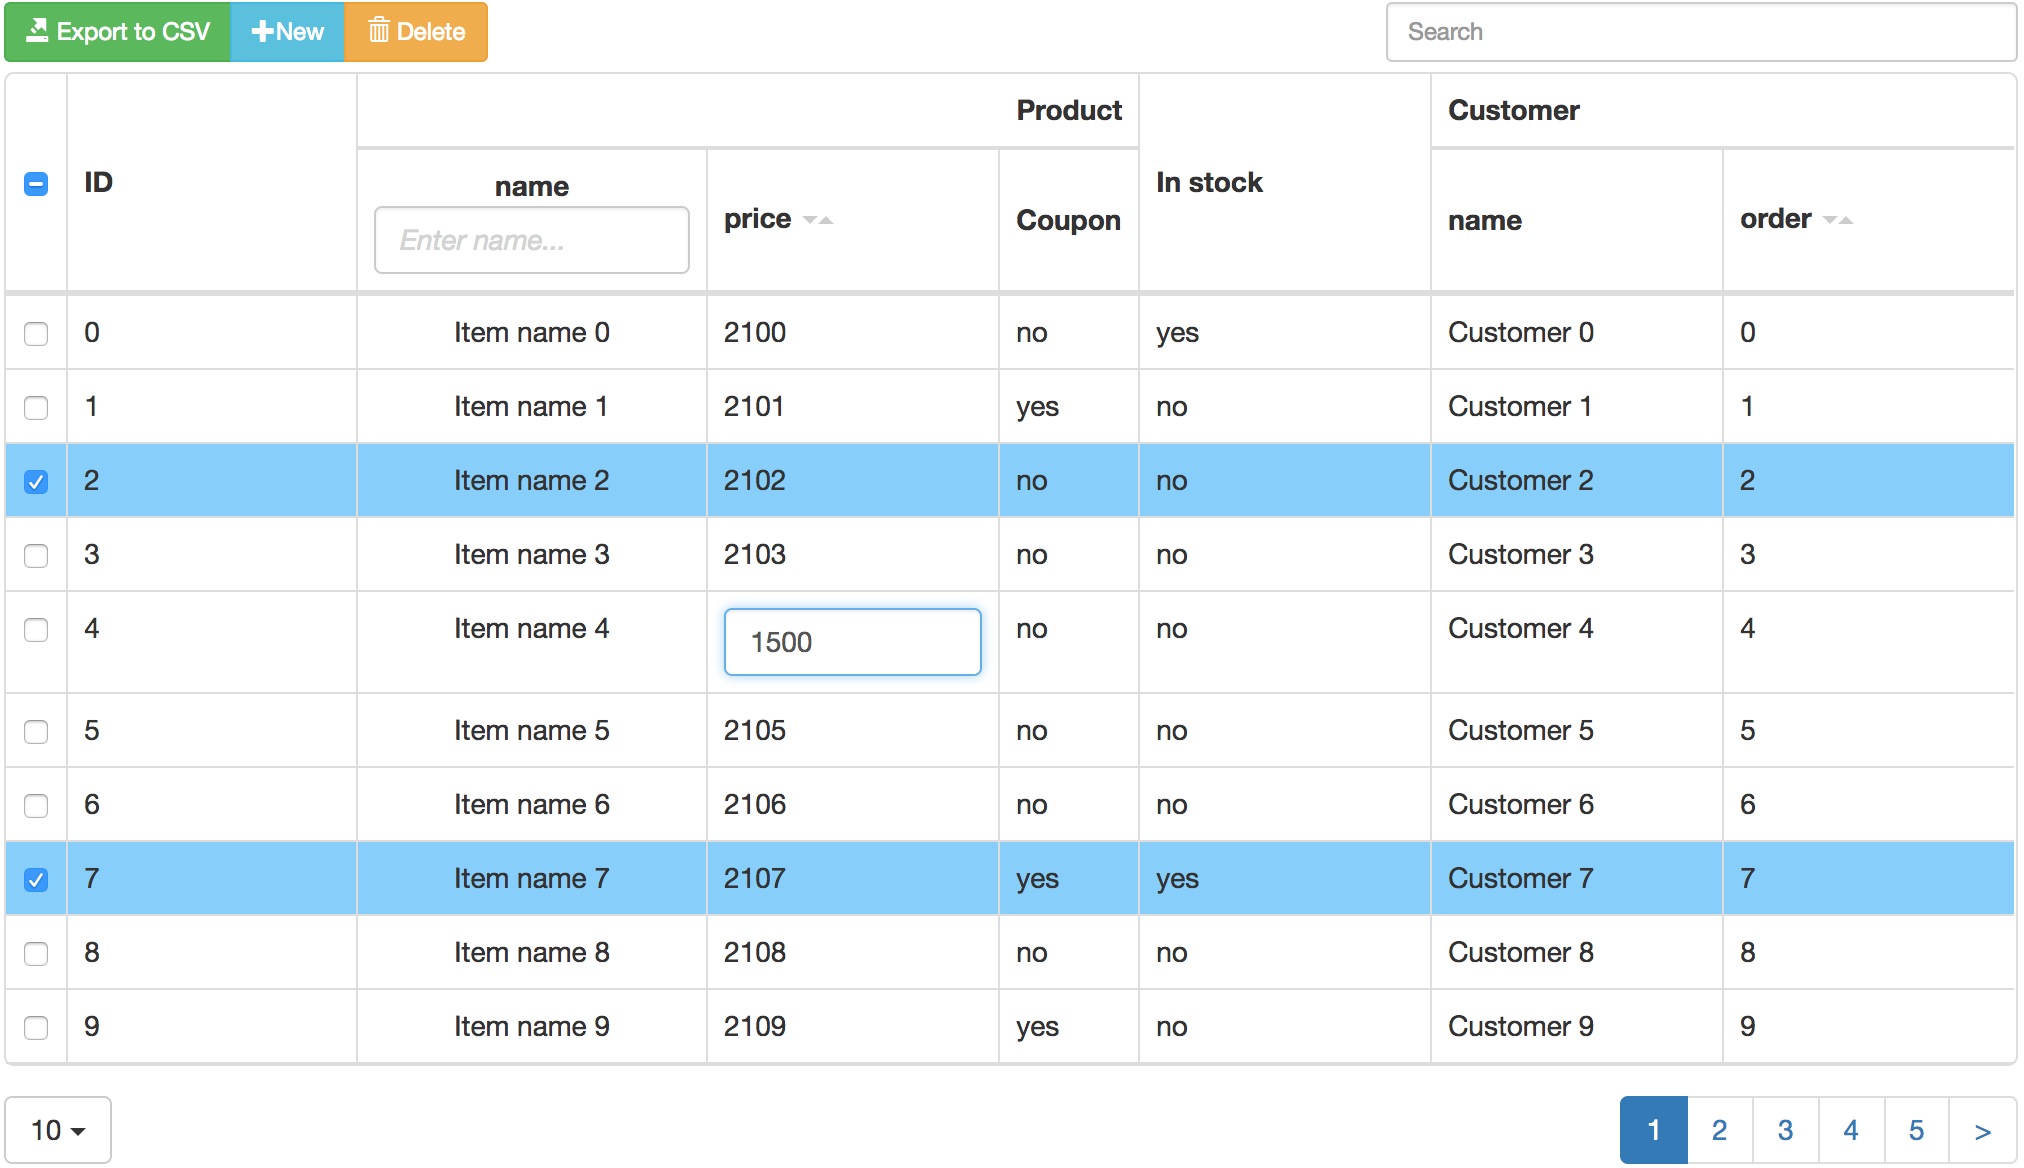
React-Bootstrap-Table
It’s a ReactJs table for bootstrap, named react-bootstrap-table. It’s a configurable, functional table component and make you build a Bootstrap Table more efficiency and easy in your ReactJs application like https://allenfang.github.io/react-bootstrap-table.
The comparison between NextJs and Create-React-App is an apt one. What NextJs brings is great defaults. Like Create-React-App, NextJs is opinionated. It makes choices for you about what an ideal React setup should look like.
One of the biggest pain points in starting a new javascript App is the tooling. Webpack, babel, and the like can be a pain to setup, especially with the aggressive release cycle of open source javascript projects. As of this writing you’re probably already using Webpack syntax that’s been deprecated.
Here are the biggest differences between Create-React-App and NextJs.
Create-React-App Is Ejectable, NextJs Is Extensible
Create-React-App uses babel, webpack, and eslint but “hides” this tooling and bundles it together in react-scripts. But Create-React-App doesn’t lock you in; when you’re ready to depart from training wheels you can unmask these dependencies and then configure them.
NextJs, on the other hand, provides great defaults with the option to configure tooling if you want to. For example, you can override (or extend) NextJs’s webpack configuration by adding a webpack.config.js file. Or you can add an express server if you don’t want to use NextJs’ server.
NextJs is Out Of The Box
The biggest point of NextJs is server-side rendering.
People will tell you that Google crawls javascript and that it’s sufficient to serve up an almost-empty html document with root class along with a massive bundle.js.
It’s true that Google crawls javascript. But this just isn’t a good approach for apps that are content-focused and need to expose their content to search.
Styling is A Pain With NextJs
NextJs can be a pain with styling. Out of the box, NextJs uses styled-jsx, which is OK. But what if you want to use SASS or styled-components? You’re in for a few hours of frustration.
You Can’t make API Calls In Components With NextJs
Initializing a new NextJs project creates two directores ./pages and ./components.
Pages are like container React components. But they have more significance than simply wrapping other components. Page components are literally rendered into pages with a little help from react-router. That is, http://localhost:3000/about points to ./pages/about.js. This approach has strengthes and limitations. One of the limitations is that you can only make a client-side fetch request in top-level page components.
Create-React-App Vs NextJs: Comparison Table
Create React App
NextJs
Dependencies
One (react-scripts)
One (next)
Ejectable
Yes
No
Extensible
No
Yes
Isomorphic/Universal
No
Yes
Zero-configuration
Yes
Yes
Service workers
Yes
No
Hot-reloading
Yes
Yes
Code-splitting
Can be configured
Out of the box
Conclusion
NextJs is a good start if you need SSR first, SEO friendly with lots of public content. But if you build a highly dynamic statically deployed Single Page Application client, CRA (Create React App) is better suited for that.
So for blog, news, with lots of public content and shareability, I’ll go with NextJs. For dashboard, admin, apps, I’ll go with CRA (Create React App)
Laravel migrations provide mechanisms for creating and modifying database tables. Migrations are database agnostic, this means you don’t have to worry about the specific SQL syntax for the database engine that you are creating tables for.
Well, in this articles I will cover the following sections: Requirements for running migrations, Artisan migration command, Migration structure, How to create a table using a migration, Laravel migration rollback, Laravel migration how-tos, Database seeding.
Requirements for Running Migrations
1. Create the database for Laravel project
2. Set the database connection parameters for Laravel project
3. Set the database connection parameters for artisan command line
1. Create the Database for Laravel Project
Open up terminator or what ever MySQL database management tool that you are using and run the command below:
1
CREATEDATABASEfoodie;
CREATE DATABASE foodie; creates a database called foodie in MySQL.
2. Set the Database Connection Parameters for Laravel Project
Open up /config/database.php file and modify to the following:
3. Set the Database Connection Parameters for Artisan Command Line
One of the challenges that most developers face when working with migrations in Laravel 5.x.x from the artisan command line is the following message:
You will get the above message even you have set the correct parameters in /config/database.php file, because the artisan command line uses the database connection parameters specified in .env file.
The solutions is go to the project open up /.env file and modify to the following:
The database, username and password must match the ones on your system.
Artisan Migration Command
We will create:
1. The migration table in our database.
2. A migration file that we will use to create a table for hard drinks.
When you create a migration file, Laravel will stores it in /database/migrations folder. You can specify a different path if you would like to but we won’t cover that in this articles. We will work with the default path.
Create Migration Table
Open up the terminator and run the following artisan command to create a migration table:
1
phpartisanmake:migrationcreate_drinks_table
php artisan make:migration executes the make migration method via the artisan command. create_drinks_table specifies the name of the migration file that will be created.
- class CreateDrinksTable extends Migration defines the CreateDrinksTable class that extends Migration class.
- public function up() defines the function that is executed when the migration is run.
- public function down() defines the function that is executed when you run migration rollback.
How to Create a Table Using a Migration
Now that we have successfully created a migration file, we will add the table definition fields in the migration modify the contents of /database/migrations/20170808072434createdrinkstable.php file.
<?phpuseIlluminate\Database\Schema\Blueprint;useIlluminate\Database\Migrations\Migration;classCreateDrinksTableextendsMigration{/** * Run the migrations. * * @return void */publicfunctionup(){Schema::create('drinks',function(Blueprint$table){$table->increments('id');$table->string('name',75)->unique();$table->text('comments')->nullable();$table->integer('rating');$table->date('brew_date');$table->timestamps();});}/** * Reverse the migrations. * * @return void */publicfunctiondown(){Schema::drop('drinks');}}
- Schema::create('drinks', function (Blueprint $table) {...} calls the create function of the Schema class. The create function is responsible for creating the database table.
- (Blueprint $table) is a closure function with a $table parameter.
- $table parameter is used to define the structure of the database.
- $table->increments('id'); increments is used to define an auto increment field.
- $table->string('name', 75)->unique(); string is used to define varchar fields. The second parameter is the length of the field. ->unique() is used to mark the column as unique.
- $table->text('comments')->nullable(); is used to define text fields. ->nullable() is used to allow the column to accept null values.
- $table->integer('rating'); integer is used to define int fields.
- $table->date('brew_date'); is used to define date fields.
- $table->timestamps(); is used to automatically create two time stamp fields namely created_at and updated_at.
Go back to the terminator and run the command below:
1
phpartisanmigrate
And then you will get many tables drinks and users, password_resets which Laravel has migrated those two tables by defaults.
Laravel Migration Rollback
One of the advantages of migrations is that it allow you to roll back to the previous state before you run the migrations. In this section, we will roll back the creation of the tables.
Go back to the terminator and run the command below:
This section I will show how to perform various Laravel migration tasks.
Laravel Migration Insert Data
This “how-to” shows you how to create a migration file that inserts data into the newly created table. We will create an employees table and add 33 seed records using Faker Library.
Open up the terminator and run the command below:
1
phpartisanmake:migrationemployees
Open up /database/migrations/xxxxxxxxx_employees.php file and add the following codes:
<?phpuseIlluminate\Database\Schema\Blueprint;useIlluminate\Database\Migrations\Migration;classEmployeesextendsMigration{/** * Run the migrations. * * @return void */publicfunctionup(){Schema::create('employees',function(Blueprint$table){$table->increments('id');$table->string('name');$table->string('email')->unique();$table->string('contact_number');$table->timestamps();});$faker=Faker\Factory::create();$limit=33;for($i=0;$i<$limit;$i++){DB::table('employees')->insert([//,'name'=>$faker->name,'email'=>$faker->unique()->email,'contact_number'=>$faker->phoneNumber,]);}}/** * Reverse the migrations. * * @return void */publicfunctiondown(){Schema::drop('employees');}}
$faker = Faker\Factory::create(); creates an instance of Faker factory. $limit = 33; sets the number of records that we want to add to the database. for($i = 0; $i < $limit; $i++) { DB::table(‘employees’)–>insert(…); } uses a for loop to add records to the database 33 times. $faker->name generates a faker name. $faker->unique()–>email generates a fake unique email address. $faker->phoneNumber generates a fake phone number.
Open up the terminator and run the following command to run the migration:
1
phpartisanmigration
Laravel Migration Add Column/Drop Colum
We will add a new gender column to employees table.
Open up the terminator and run the following command:
—table=employees tells Laravel we want to work with an existing table called employees.
Open up /database/migration/xxxxxxx_add_gender_to_employees.php and modify to the following:
xxxxxxx_add_gender_to_employees.php
1234567891011121314151617181920212223242526272829
<?phpuseIlluminate\Database\Schema\Blueprint;useIlluminate\Database\Migrations\Migration;classAddGenderToEmployeesextendsMigration{/ * Run the migrations. * @return void /publicfunctionup(){Schema::table('employees',function(Blueprint$table){$table–>string('gender')–>after('contact_number');});}/ * Reverse the migrations. * @return void /publicfunctiondown(){Schema::table('employees',function(Blueprint$table){$table–>dropColumn('gender');});}}
public function up() {…} uses Schema::table(‘employees’ …) to add a new column gender. public function down() {…} drops the new column from the table when we reverse the command. $table->dropColumn(‘gender’); is the command that drops the table.
Laravel Migration Change Column Type
We have created the gender column with the default size of 255. We want to change it to 5 as the maximum size.
Open up the terminator and run the following command:
Open up /database/migrations/xxxxxxx_modify_gender_in_employees.php file and modify to the following:
xxxxxxx_modify_gender_in_employees.php
1234567891011121314151617181920212223242526272829
<?phpuseIlluminate\Database\Schema\Blueprint;useIlluminate\Database\Migrations\Migration;classModifyGenderInEmployeesextendsMigration{/ * Run the migrations. * @return void /publicfunctionup(){Schema::table('employees',function(Blueprint$table){$table–>string('gender',5)–>change();});}/ * Reverse the migrations. * @return void /publicfunctiondown(){Schema::table('employees',function(Blueprint$table){$table–>string('gender',255)–>change();});}}
$table->string(‘gender’, 5)–>change(); maintains the varchar data type and sets the character limit to 5. If we wanted to change the data type too, we would have specified a different data type. $table->string(‘gender’, 255)–>change(); rollback the migration to the previous state.
Open up the terminator and run the following command to run the migration:
1
phpartisanmigrate
Laravel Migration Nullable
By default, Laravel assumes all columns are required unless you tell it so let’s assume the gender field is optional.
Open up the terminator and run the following command to create a migration file:
Open up /database/migrations/xxxxxxx_make_gender_null_in_employees.php file and modify to the following:
xxxxxxx_make_gender_null_in_employees.php
12345678910111213141516171819202122232425262728
<?phpuseIlluminate\Database\Schema\Blueprint;useIlluminate\Database\Migrations\Migration;classMakeGenderNullInEmployeesextendsMigration{/ * Run the migrations. * @return void /publicfunctionup(){Schema::table('employees',function(Blueprint$table){$table–>string('gender',5)–>nullable()–>change();});}/ * Reverse the migrations. * @return void /publicfunctiondown(){Schema::table('employees',function(Blueprint$table){$table–>string('gender',5)–>change();});}}
Laravel Migration Foreign Key
Let’s say we want to group our employees by their departments, we can add a foreign key for the dept_id.
Open up the terminator and run the following command to create a migration file for depts table:
1
phpartisanmake:migrationdepts
Open up /database/migrations/xxxxxxxxx_depts.php file and add the following codes:
xxxxxxxxx_depts.php
1234567891011121314151617181920212223242526272829
<?phpuseIlluminate\Database\Schema\Blueprint;useIlluminate\Database\Migrations\Migration;classDeptsextendsMigration{/ * Run the migrations. * @return void /publicfunctionup(){Schema::create('depts',function(Blueprint$table){$table–>increments('id');$table–>string('name');$table–>timestamps();});}/ * Reverse the migrations. * @return void /publicfunctiondown(){Schema::drop('depts');}}
Open up the terminator and run the following command to create the depts table:
1
phpartisanmigrate
The primary and foreign key relationship requires both tables to have the same data type and length. We used Schema’s increments to define the primary key for depts id. Schema’s increments creates an unsigned integer INT(10), Schema’s integer creates signed integer INT(11).
We need to use Schema’s unsignedInteger when creating dept_id so that both the primary and foreign keys will be INT(10).
Open up the terminator and run the following command to create the migration for adding the dept_id to the employees table:
<?phpuseIlluminate\Database\Schema\Blueprint;useIlluminate\Database\Migrations\Migration;classAddDeptIdInEmployeesextendsMigration{/ * Run the migrations. * @return void /publicfunctionup(){Schema::table('employees',function(Blueprint$table){$table–>unsignedInteger('dept_id')–>after('gender');$table–>foreign('dept_id')–>references('id')–>on('depts')–>onDelete('cascade');});}/ * Reverse the migrations. * @return void /publicfunctiondown(){Schema::table('employees',function(Blueprint$table){$table–>dropColumn('dept_id');});}}
Open up the terminator and run the following command to execute the migration:
1
phpartisanmigrate
Database Seeding
In this section, we will add dummy data to our database. Seeding is a term that is used to describe the process of adding data to the database.
Open up the terminator and run the following command:
1
phpartisanmake:seederDrinksTableSeeder
Open up /database/seeds/DrinksTableSeeder.php file and add the following codes:
DrinksTableSeeder.php
1234567891011121314151617181920
<?phpuseIlluminate\Database\Seeder;classDrinksTableSeederextendsSeeder{/ * Run the database seeds. * @return void /publicfunctionrun(){DB::table('drinks')–>insert(['name'=>'Vodka','comments'=>'Blood of creativity','rating'=>9,'brew_date'=>'1973-09-03',]);}}
class DrinksTableSeeder extends Seeder defines the table DrinksTableSeeder that extends the Seeder class. public function run() defines the function that is executed when you run the seed command from artisan.
The above table uses an array that matches database field name to values and inserts the record into the specified table drinks. Now let’s run the seed and add our dummy record to the database.
Open up the terminator and run the following command:
Blade is a powerful easy to use template that comes with Laravel. Blade templates can be mixed with plain php code.
Well, in this articles I will cover the following sections: Template inheritance, Master layout, Extending the master layout, Displaying variables, Blade conditional statements, Blade Loops and Executing PHP functions in blade template.
Template Inheritance
In a nutshell, template inheritance allows us to define a master layout with elements that are common to all web pages. The individual pages extend the master layout. This saves us time of repeating the same elements in the individual pages.
Master Layout
All blade templates must be saved with the .blade extension. In this section, we are going to create a master template that all pages will extend. The following is the syntax for defining a master layout.
Create a new file named master.blade.php in /resources/views/layouts folder with the following code below:
- @yield('title') is used to display the value of the title.
- @section('sidebar') is used to define a section named sidebar.
- @show is used to display the contents of a section.
- @yield('content') is used to display the contents of content.
Extending the Master Layout
Now we will create a page that extends the master layout. Create a new page named page.blade.php in /resources/views folder with the following code below:
- @extends('layouts.master') is used to extends the master layout.
- @section('title', 'Page Title') is used to sets the value of the title section.
- @section('sidebar') is used to defines a sidebar section in the child page of master layout.
- @endsection is used to ends the sidebar section.
- @section('content') is used to defines the content section.
And now we will add a route to tests our blade template. Open up /routes/web.php file and add the following route below:
Load the http:://localhost:8000/blade URL in your web browser and you will see the paragraph.
Displaying Variables in a Blade Template
Now we will define a variable and pass it to our blade template view. Open up /routes/web.php file and add the route below:
{{$name}} double opening curly braces and double closing curly braces are used to display the value of $name variable.
Blade Condition Statements
Blade also supports conditional statements. Conditional statements are used to determine what to display in the browser. We will pass a variable that will determine what to display in the browser.
Open up /routes/web.php file and modify route as follow:
- @if ($day == 'Sunday') starts the if statement and evaluates the condition $day == ‘Sunday’.
- @else is the else part of the if statement.
- @endif ends the if statement.
Blade Loop
Blade template supports all of the loops that PHP supports. We will look at how we can use the foreach loop in blade to loop through an array of items.
Open up /routes/web.php file and modify the codes for the blade route to the following:
Executing php functions in Blade
We will call the php date function in the blade template. Open up /resources/views/page.blade.php file and modify the contents to the following: