Ruby on Rails Charting With Chartkick Gem

Ruby on Rails Charting with Chartkick Gem

Chartkick is a charting library for Ruby on Rails that allows you to easily create nice looking charts. Chartkick is compatible with all major browsers and can easily be used to give your Ruby on Rails application some additional flair. In this article we will cover the basics of using Chartkick.

Rails Application Setup
Before we can use Chartkick, we will need to add it to our Gemfile. Open up your Gemfile and add the following code.

Gemfile
1
gem 'chartkick', '~> 1.2.4'

In addition, let’s include a couple of helper gems that will make life easier when dealing with data. Add the following gems to your Gemfile.

Gemfile
1
2
gem 'groupdate', '~> 2.1.1'
gem 'active_median', '~> 0.1.0'

Now let’s run a bundle install to install all three gems.

1
bundle install

Now we need to create a model that we will use with our charts. For this example app we will create a simple model called Visit. This model will represent a single user’s ‘visit’ to a website. Run the command below to create this model now.

1
rails g model Visit country:string visited_at:datetime load_time:decimal

Now let’s run a rake db:migrate to create the table associated with this model.

1
rake db:migrate

Now we need to add some data to our seeds file in order to give us some data to play with. Open up your seeds.rb file and add in the code listed below.

db/seeds.rb
1
2
3
4
5
6
7
8
9
10
11
12
13
14
15
16
17
18
19
20
21
22
23
24
25
26
27
28
29
30
31
Visit.delete_all
Visit.create  country: 'United States', visited_at: DateTime.now, load_time: 3.5
Visit.create  country: 'United States', visited_at: DateTime.now, load_time: 1.5
Visit.create  country: 'United States', visited_at: DateTime.now, load_time: 1.0
Visit.create  country: 'United States', visited_at: DateTime.now - 1.day, load_time: 4.5
Visit.create  country: 'United States', visited_at: DateTime.now - 1.day, load_time: 4.0
Visit.create  country: 'United States', visited_at: DateTime.now - 2.days, load_time: 3.5
Visit.create  country: 'United States', visited_at: DateTime.now - 2.days, load_time: 1.0
Visit.create  country: 'United States', visited_at: DateTime.now - 2.days, load_time: 3.5
Visit.create  country: 'United States', visited_at: DateTime.now - 3.days, load_time: 4.5
Visit.create  country: 'United States', visited_at: DateTime.now - 3.days, load_time: 3.0
Visit.create  country: 'Germany', visited_at: DateTime.now, load_time: 1.0
Visit.create  country: 'Germany', visited_at: DateTime.now, load_time: 2.0
Visit.create  country: 'Germany', visited_at: DateTime.now, load_time: 1.0
Visit.create  country: 'Germany', visited_at: DateTime.now, load_time: 3.0
Visit.create  country: 'Germany', visited_at: DateTime.now - 1.day, load_time: 4.0
Visit.create  country: 'Germany', visited_at: DateTime.now - 2.days, load_time: 2.0
Visit.create  country: 'Germany', visited_at: DateTime.now - 2.days, load_time: 1.0
Visit.create  country: 'Germany', visited_at: DateTime.now - 2.days, load_time: 3.0
Visit.create  country: 'Germany', visited_at: DateTime.now - 3.days, load_time: 3.5
Visit.create  country: 'South Korea', visited_at: DateTime.now, load_time: 2.0
Visit.create  country: 'South Korea', visited_at: DateTime.now, load_time: 2.5
Visit.create  country: 'South Korea', visited_at: DateTime.now, load_time: 1.0
Visit.create  country: 'South Korea', visited_at: DateTime.now, load_time: 1.5
Visit.create  country: 'South Korea', visited_at: DateTime.now - 1.day, load_time: 2.5
Visit.create  country: 'South Korea', visited_at: DateTime.now - 1.day, load_time: 4.0
Visit.create  country: 'South Korea', visited_at: DateTime.now - 1.day, load_time: 3.0
Visit.create  country: 'South Korea', visited_at: DateTime.now - 2.days, load_time: 1.0
Visit.create  country: 'South Korea', visited_at: DateTime.now - 3.days, load_time: 5.0
Visit.create  country: 'South Korea', visited_at: DateTime.now - 3.days, load_time: 4.0
Visit.create  country: 'South Korea', visited_at: DateTime.now - 3.days, load_time: 5.0

Now let’s run a rake db:seed to seed our database.

1
rake db:seed

Now let’s create a controller to give us a place to play around. Run the commands below to create the Homes controller.

1
rails g controller homes show

Now open up your routes file and add in the route listed below.

1
2
3
Rails.application.routes.draw do
  root to: "homes#show"
end

Next, open up your homes controller and modify it so that it looks like the code listed below.

app/controllers/homes_controller.rb
1
2
3
4
5
class HomesController < ApplicationController
  def show
    @visits = Visit.all
  end
end

Finally, we need to modify our application layout. Open up your application’s layout and modify it so that it looks like the following code. Note the inclusion of the Google API javascript file below. Chartkick can use either Google Charts or Highcharts for charting. In this example we use Google Charts. We also utilize Bootstrap for a cleaner look and feel.

app/views/layouts/application.rb
1
2
3
4
5
6
7
8
9
10
11
12
13
14
15
16
17
18
19
<!DOCTYPE html>
<html>
<head>
  <title>ChartKickExample</title>
  
  <%= stylesheet_link_tag    'application', media: 'all' %>
  <%= javascript_include_tag 'application' %>
  <%= javascript_include_tag "http://www.google.com/jsapi", "chartkick" %>
  <%= stylesheet_link_tag 'http://yandex.st/bootstrap/3.1.1/css/bootstrap.min.css' %>
  <%= javascript_include_tag 'http://yandex.st/bootstrap/3.1.1/js/bootstrap.min.js' %>
  
  <%= csrf_meta_tags %>
</head>
<body>
  <div class="container">
    <%= yield %>
  </div>
</body>
</html>

Line Charts
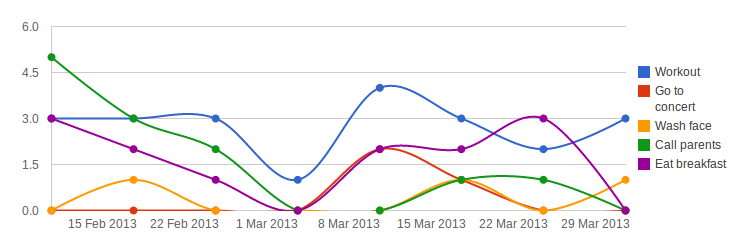
The first chart type we will work with is the line charts Line charts are handy for doing things like plotting out events over time. Open up your show view for the Homes controller and modify it so that it looks like the code listed below.

app/views/homes/show.html.erb
1
2
3
4
5
6
7
8
9
<div class="row">

  <!-- Line Chart - Single Series -->
  <div class="col-xs-6">
    <h3>Visits By Day</h3>
    <%= line_chart @visits.group_by_day(:visited_at, format: "%B %d, %Y").count, discrete: true %>
  </div>

</div>

Now if you start a rails s and navigate to http://localhost:3000 you will see a chart being rendered showing the number of vists by day.

Great, now lets make a slightly more complex line chart. Open up the show view again and modify it so that it looks like the code listed below.

app/views/homes/show.html.erb
1
2
3
4
5
6
7
8
9
10
11
12
13
14
15
<div class="row">

  <!-- Line Chart - Single Series -->
  <div class="col-xs-6">
    <h3>Visits By Day</h3>
    <%= line_chart @visits.group_by_day(:visited_at, format: "%B %d, %Y").count, discrete: true %>
  </div>

  <!-- Line Chart - Multiple Series -->
  <div class="col-xs-6">
    <h3>Visits By Country Per Day</h3>
    <%= line_chart   Visit.pluck("country").uniq.map { |c| { name: c, data: @visits.where(country: c).group_by_day(:visited_at, format: "%B %d, %Y").count }  }, discrete: true %>
  </div>

</div>

Refreshing the page results in a new line chart with multiple series listed. You see a line for each country with each point corresponding to the number of visits for that day.

Pie Charts and Area Charts
We can also render a pie chart. Open up your show view again and append the following code to the end of the view.

app/views/homes/show.html.erb
1
2
3
4
5
6
<div class="row">
  <div class="col-xs-6">
    <h3>Total Visits by Country</h3>
    <%= pie_chart @visits.group(:country).count %>
  </div>
</div>

If you refresh the page a pie chart will render with each slice representing the visits for that particular country. This information can also be represented via a geo chart. Modify your homes view to look like the code listed below.

app/views/homes/show.html.erb
1
2
3
4
5
6
7
8
9
10
11
12
13
14
15
16
17
18
19
20
21
22
23
24
25
26
27
28
29
30
31
<div class="row">

  <!-- Line Chart - Single Series -->
  <div class="col-xs-6">
    <h3>Visits By Day</h3>
    <%= line_chart @visits.group_by_day(:visited_at, format: "%B %d, %Y").count, discrete: true %>
  </div>

  <!-- Line Chart - Multiple Series -->
  <div class="col-xs-6">
    <h3>Visits By Country Per Day</h3>
    <%= line_chart   Visit.pluck("country").uniq.map { |c| { name: c, data: @visits.where(country: c).group_by_day(:visited_at, format: "%B %d, %Y").count }  }, discrete: true %>
  </div>

</div>

<div class="row">

  <!-- Pie Chart -->
  <div class="col-xs-6">
    <h3>Total Visits by Country</h3>
    <%= pie_chart @visits.group(:country).count %>
  </div>

  <!-- Geo Chart --> 
  <div class="col-xs-6">
    <h3>Visits By Day</h3>
    <%= geo_chart @visits.group(:country).count %>
  </div>

</div>

Awesome! Now if you refresh the page, you’ll notice a geo chart in the bottom right.

Area Charts
You can also create an area chart. Add the code listed below to the end of your homes/show view.

app/views/homes/show.html.erb
1
2
3
4
5
6
7
<!-- area chart -->
<div class="row">
  <div class="col-xs-12">
    <h3>Total Load Time By Day</h3>
    <%= area_chart @visits.group_by_day(:visited_at).maximum(:load_time) %>
  </div>
</div>

Great, now if you refresh the page you will see that the area chart has been added.

Bar Charts and Column Charts
Both bar charts and column charts can be easily created. Modify your homes/show view so that it looks like the code listed below.

app/views/homes/show.html.erb
1
2
3
4
5
6
7
8
9
10
11
12
13
14
15
16
17
18
19
20
21
22
23
24
25
26
27
28
29
30
31
32
33
34
35
36
37
38
39
40
41
42
43
44
45
46
47
48
49
50
51
52
<div class="row">

  <!-- Line Chart - Single Series -->
  <div class="col-xs-6">
    <h3>Visits By Day</h3>
    <%= line_chart @visits.group_by_day(:visited_at, format: "%B %d, %Y").count, discrete: true %>
  </div>

  <!-- Line Chart - Multiple Series -->
  <div class="col-xs-6">
    <h3>Visits By Country Per Day</h3>
    <%= line_chart   Visit.pluck("country").uniq.map { |c| { name: c, data: @visits.where(country: c).group_by_day(:visited_at, format: "%B %d, %Y").count }  }, discrete: true %>
  </div>

</div>

<div class="row">

  <!-- Pie Chart -->
  <div class="col-xs-6">
    <h3>Total Visits by Country</h3>
    <%= pie_chart @visits.group(:country).count %>
  </div>

  <!-- Geo Chart --> 
  <div class="col-xs-6">
    <h3>Visits By Day</h3>
    <%= geo_chart @visits.group(:country).count %>
  </div>

</div>

<!-- area chart --> 
<div class="row">
  <div class="col-xs-12">
    <h3>Total Load Time By Day</h3>
    <%= area_chart @visits.group_by_day(:visited_at).maximum(:load_time) %>
  </div>
</div>

<div class="row">
  <!-- Column Chart -->
  <div class="col-xs-6">
    <h3>Total Visits Per Country</h3>
    <%= column_chart @visits.group(:country).count %>
  </div>
  <!-- Bar Chart -->
  <div class="col-xs-6">
    <h3>Total Visits Per Country</h3>
    <%= bar_chart @visits.group(:country).count %>
  </div>
</div>

If you refresh the page you’ll see both column and bar charts at the bottom.

Remote Charts
You can quickly and easily build remote AJAX driven charts. Let’s create a simple series chart. First, we will create a new method on your homes controller called visits_by_day. Open up your homes controller and modify it so that it looks like the code listed below.

app/controllers/homes_controller.rb
1
2
3
4
5
6
7
8
9
class HomesController < ApplicationController
  def show
    @visits = Visit.all
  end

  def visits_by_day
   render json: Visit.group_by_day(:visited_at, format: "%B %d, %Y").count
  end
end

Next, add in the code listed below to your homes/show view.

app/views/homes/show.html.erb
1
2
3
4
5
<!-- Line Chart - Single Series -->
<div class="col-xs-12">
  <h3>Visits By Day</h3>
  <%= line_chart visits_by_day_home_path %>
</div>

If you refresh the page, you’ll notice that the new chart has been rendered. A quick look at your browser’s developer console will show you that the visits_by_day data is pulled down via AJAX and then the site is rendered.

Global Options
You can customize the global options for ChartKick. Create an initializer called chartkick.rb and add in the code listed below.

config/initializers/chartkick.rb
1
2
3
4
Chartkick.options = {
  height: "300px",
  colors: ["#ff0000", "#00ff00", "#0000ff", "#ffff00", "#ff00ff", "0000ff"]
}

If you restart your Rails server and refresh the page, you will notice that the colors have changed.

For more information on ChartKick you can check Chartkick.

So far so good, That’s it!!! See ya!!! :)